You have run kubectl apply -f deployment.yaml a few thousand times. Pods appear. Occasionally they don't, and you run kubectl describe pod, read an event about insufficient CPU or an image pull backoff, fix it, and move on. But if someone asked you to narrate what happened between pressing Enter and the container process starting which component wrote what, where it was stored, and who noticed most engineers wave a hand somewhere around "the scheduler does it."
That gap costs you during incidents, because Kubernetes architecture is mostly a story about handoffs. Nearly every painful failure is one specific component in that chain misbehaving, and the symptom almost never names the culprit: a stuck rollout can be etcd disk latency, a scheduler predicate, a kubelet that lost its watch, or a CNI plugin that ran out of IPs. This guide traces a single apply end to end and explains the system in terms of who writes, who watches, and who acts. By the end you should be able to look at a symptom and name the two or three components that could plausibly produce it.
The write path: what kubectl apply actually does
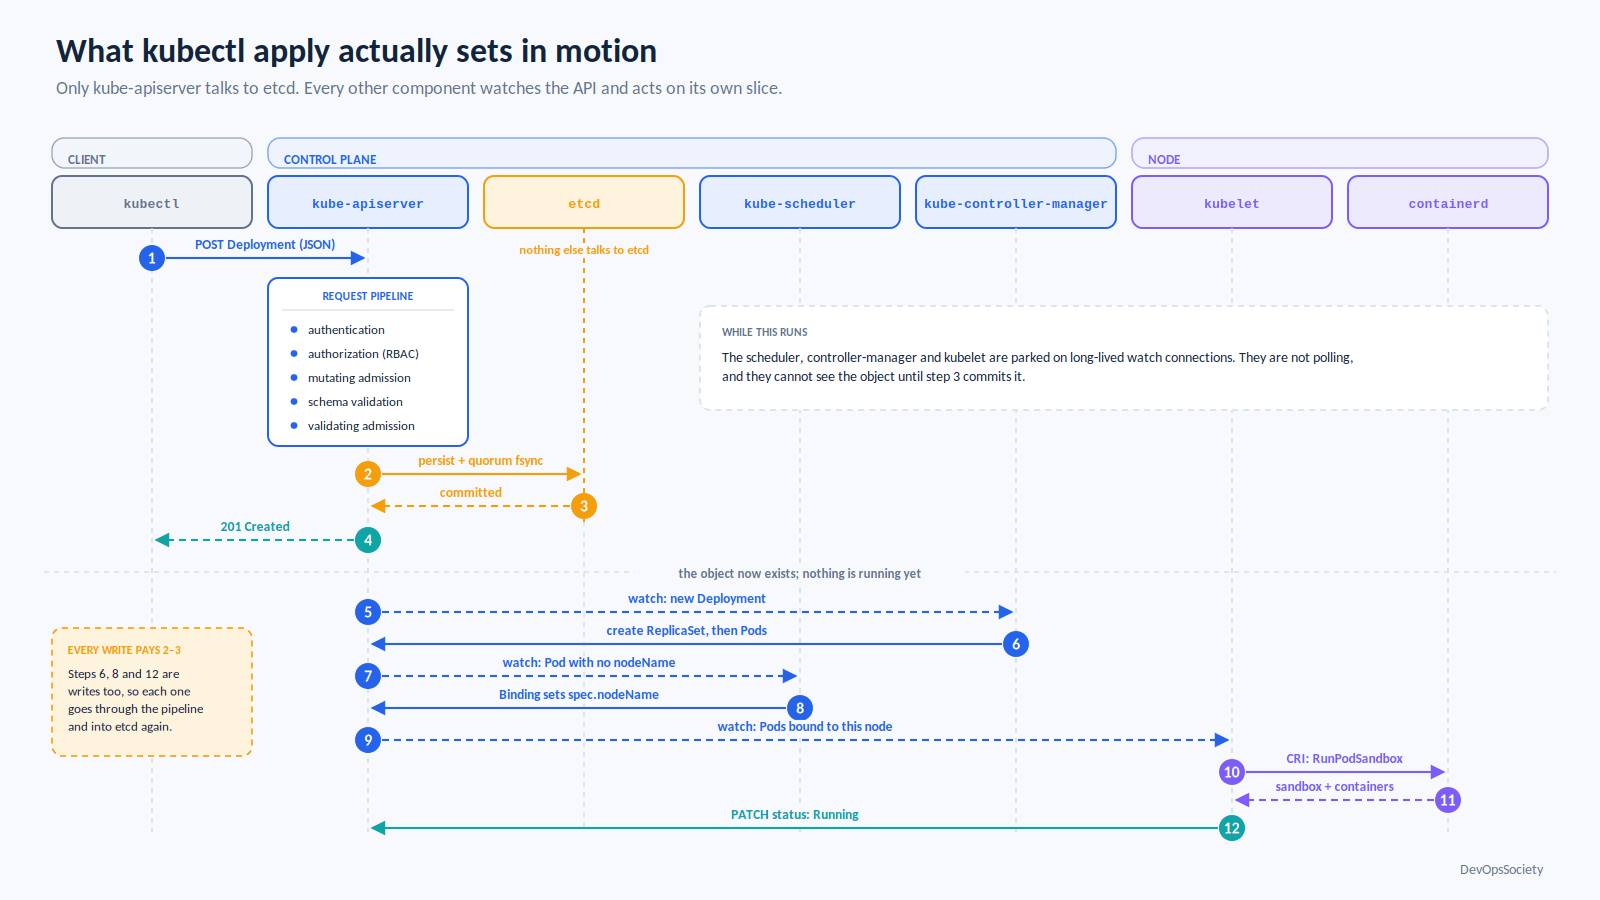
kubectl is a REST client. It reads your YAML, converts it to JSON, and issues an HTTP request to the kube-apiserver. That's the entire client-side story. The interesting work starts on the other end.
The apiserver runs the request through a fixed pipeline: authentication (client cert, OIDC token, or a cloud IAM webhook), authorization (RBAC, almost always), mutating admission, schema validation, then validating admission. Mutating admission is where your service mesh injects a sidecar and where defaulting webhooks stamp in labels; validating admission is where policy engines like Kyverno or Gatekeeper reject the object. Since 1.30 you can express a large class of those rules natively with ValidatingAdmissionPolicy and CEL, which removes a webhook from the critical path worth doing, because every admission webhook is a synchronous dependency of every write to the resources it watches.
Only after all of that does the apiserver persist the object to etcd. This is the single most important structural fact about the control plane: nothing except the apiserver talks to etcd. Not the scheduler, not the controllers, not the kubelet. Every other component is a client of the apiserver's watch API. That's why the apiserver is the availability boundary of the whole cluster, and why "etcd is slow" and "the cluster is broken" are usually the same sentence.
Note what has not happened yet. No node has been chosen. No container exists. All that exists is a record in etcd saying "the user would like three replicas of this thing." The gap between that record and reality is the entire job of everything else.
Why etcd shows up in every serious outage
etcd is a Raft-replicated key-value store. Every write must be committed by a quorum and fsynced to disk before the apiserver returns success. That makes disk write latency, not CPU, the thing that determines how fast your cluster feels. The metric to alert on is etcd_disk_wal_fsync_duration_seconds when its p99 drifts past roughly ten milliseconds on a busy cluster, you will see it as slow kubectl commands, leader elections flapping, and controllers falling behind. Put etcd on local NVMe, never on network-attached storage you share with anything else.
The other etcd failure mode is size. The apiserver's watch cache has to read the full state of a resource from etcd at startup and on every re-initialisation, which is expensive when you have 40,000 Pods or a handful of very large objects. Kubernetes 1.37 graduated etcd RangeStream to beta to stream those large LIST reads instead of materialising them in memory, which noticeably flattens apiserver memory spikes it needs etcd v3.7. Until you're on that, a restarting apiserver on a large cluster is a memory event, and stacking three of them behind a load balancer that restarts them together is how you turn a blip into an outage.
The reconciliation loop is the whole idea
Everything past the apiserver is a variation on one pattern. A controller opens a watch, receives the current state of some resource, compares it to the desired state, and takes one small action to close the gap. Then it does it again. Forever.
This is worth internalising because it explains behaviour that otherwise looks arbitrary. There is no transaction spanning "create Deployment" and "container running." There is a chain of independent loops, each of which only knows about its own slice: the Deployment controller creates a ReplicaSet, the ReplicaSet controller creates Pods, the scheduler assigns those Pods to nodes, the kubelet on each node starts containers. Each hands off through the API, and each can be stuck independently.
It also explains why Kubernetes is forgiving of partial failure and unforgiving of bad desired state. Kill a controller and nothing breaks immediately; it just stops converging, and when it comes back it reconciles from current reality rather than replaying a queue. But write a manifest that can never be satisfied a nodeSelector matching no node, a PVC for a StorageClass that doesn't exist and the loop will retry patiently and silently until you go looking. This is the same declarative model that makes GitOps work, and if your deployments flow through a pipeline, it's the reason the handoff between your CI system and the cluster should push desired state rather than imperatively drive a rollout.
Kubernetes architecture: the control plane components
kube-scheduler
The scheduler watches for Pods with an empty spec.nodeName. For each one it runs two phases over the candidate nodes: filter, which eliminates nodes that cannot run the Pod (insufficient allocatable CPU or memory, taints without a matching toleration, unsatisfied node affinity, no free host port), and score, which ranks the survivors on spread, image locality, and resource balance. It then writes a Binding object back to the apiserver setting spec.nodeName.
That last detail matters: the scheduler never contacts a node. It makes a decision and writes it down. If the scheduler is down, existing Pods keep running and new ones sit in Pending forever with no events beyond "0/N nodes are available."
The scheduler's characteristic failure is starvation rather than crashing. A large Pod that cannot fit anywhere blocks nothing by default the scheduler moves on but a cluster where every node is 85% allocated will cheerfully fail to place a 4-CPU Pod while showing plenty of aggregate headroom. Pod priority and preemption fix this properly; setting requests you actually measured fixes it cheaply. Kubernetes 1.37 also brought gang scheduling to beta, which makes all-or-nothing placement for a group of Pods a first-class concept instead of something you bolt on with Volcano or Kueue relevant if you're running distributed training, irrelevant otherwise.
kube-controller-manager
A single binary running several dozen control loops in goroutines: Deployment, ReplicaSet, StatefulSet, DaemonSet, Job, endpoint slices, service accounts, node lifecycle, and more. Cloud-specific loops provisioning load balancers, attaching EBS volumes, labelling nodes with zone topology live in a separate cloud-controller-manager, which is the seam where your cluster meets your provider's control plane and where the tradeoffs in how you lay out an AWS account, its VPC and its IAM boundaries start leaking into cluster behaviour.
The node lifecycle controller is the one that surprises people. It marks a node NotReady when the kubelet stops posting heartbeats past the grace period (50 seconds by default; it was 40 until v1.32), then applies a NotReady taint. Pods are not evicted immediately the default toleration gives them five more minutes. So the wall-clock gap between a node dying and its Pods being rescheduled is closer to six minutes than to zero, out of the box. If that's too slow for you, tune tolerationSeconds on the workloads that matter and leave the rest alone.
What happens on the node
Everything up to this point has been bookkeeping. The half of Kubernetes architecture that actually runs your code lives on the worker nodes, and it is deliberately dumb: a node knows only about the Pods assigned to it and has no idea the rest of the cluster exists.
kubelet and the container runtime
The kubelet watches the apiserver for Pods bound to its own node. When one appears it does the work: pulls images, mounts volumes, sets resource limits, and asks the container runtime to create a Pod sandbox and then the containers inside it.
It asks over the Container Runtime Interface, a gRPC API. Since 1.24 there is no built-in path to Docker Engine at all dockershim was removed from the kubelet in that release, and anyone still wanting Docker Engine underneath needs Mirantis's cri-dockerd shim. In practice everyone runs containerd or CRI-O, both of which shell out to an OCI runtime (runc, or crun if you care about startup latency) to actually create the namespaces and cgroups.
The kubelet is also what makes your Pod's status true. kubectl get pods shows you what the kubelet last reported, not what is running. A kubelet that has lost its connection to the apiserver keeps its containers alive perfectly well while the control plane slowly concludes the node is dead which is why "node NotReady but the app is still serving traffic" is a normal, and briefly correct, state.
CNI and how a Pod gets an IP
The runtime, not the kubelet, invokes the CNI plugin when it creates the Pod sandbox. The plugin allocates an IP from the range assigned to that node, wires a veth pair into the Pod's network namespace, and programs whatever routing or overlay the plugin implements VXLAN for Flannel, BGP or eBPF for Calico and Cilium, real VPC IPs for the AWS VPC CNI.
The failure mode here is IP exhaustion, and it looks nothing like a networking error. Pods sit in ContainerCreating with a FailedCreatePodSandBox event, and unless you read the plugin's logs you'll chase the runtime instead. On the AWS VPC CNI specifically, the per-node Pod ceiling is a function of instance type and ENI limits, not of CPU a node with capacity to spare can simply refuse to take more Pods.
Pods: the unit of scheduling, not the unit of work
A Pod is one or more containers that share a network namespace, an IPC namespace, and a set of volumes. They get one IP between them and reach each other on localhost. The Pod, not the container, is what the scheduler places and what the cluster counts.
Two things about Pods have changed recently enough to be worth restating. First, sidecars are native now. Since 1.28, and stable since 1.33, a container in initContainers with restartPolicy: Always starts before the main containers, keeps running alongside them, and critically does not prevent a Job from completing. If you are still running a log shipper or a proxy as a regular container and papering over Job completion with a shared-volume kill file, delete that.
apiVersion: apps/v1
kind: Deployment
metadata: { name: checkout }
spec:
  replicas: 3
  selector: { matchLabels: { app: checkout } }
  template:
    metadata: { labels: { app: checkout } }
    spec:
      initContainers:
        - name: log-shipper
          image: fluent-bit:3.2
          restartPolicy: Always   # makes this a native sidecar, not a blocking init container
      containers:
        - name: app
          image: registry.internal/checkout:1.9.3
          ports: [{ containerPort: 8080 }]
          resources:
            requests: { cpu: 250m, memory: 256Mi }   # what the scheduler filters on
            limits:   { memory: 512Mi }              # memory limit only; CPU limits cause throttling
Second, Pods are no longer quite as immutable as the folklore says. In-place Pod resize went stable in 1.35, so CPU and memory on a running Pod can be changed through the resize subresource without recreating it. Memory shrinks may still need a restart depending on the configured restart policy for that resource, but the default assumption "any resource change means a new Pod" is now wrong on current clusters.
Services and the three ways traffic reaches a Pod
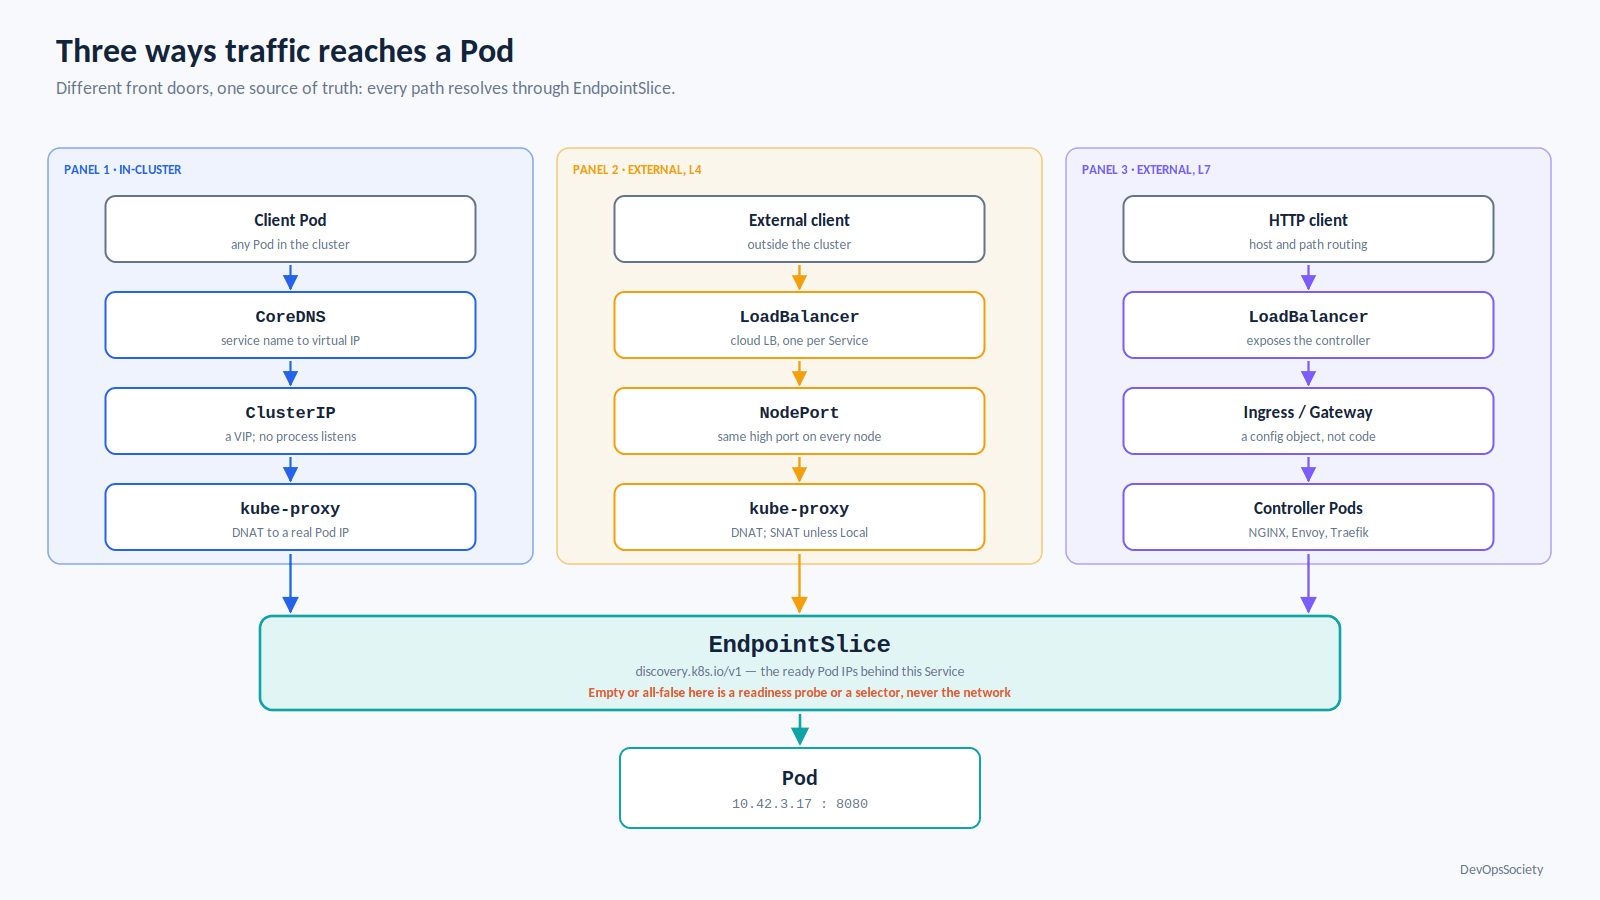
Pod IPs are disposable. A Service gives you a stable name and a stable virtual IP in front of a changing set of them. The mapping from Service to Pod IPs lives in EndpointSlice objects, maintained by a controller in the controller-manager.
EndpointSlice replaced the old Endpoints object for a reason: Endpoints crammed every backend into a single resource, so one Pod churning in a 2,000-replica Service rewrote and re-broadcast the whole thing. EndpointSlice shards that into chunks of a hundred. As of 1.33 the Endpoints API is still populated for compatibility but is effectively frozen every Service feature added since, including dual-stack and traffic distribution, exists only on EndpointSlice. If you're writing a controller, target discovery.k8s.io/v1 and don't look back.
# The Service's virtual IP tells you nothing about health. The slices do.
kubectl get endpointslices -l kubernetes.io/service-name=checkout \
  -o custom-columns=NAME:.metadata.name,READY:.endpoints[*].conditions.ready,IPS:.endpoints[*].addresses

# Empty or all-false means your selector or your readiness probe is the problem, not the network.
ClusterIP is the default and covers in-cluster traffic. kube-proxy watches EndpointSlices and programs the node's dataplane so that packets to the virtual IP get DNAT'd to a real Pod IP. The mode matters at scale: the classic iptables mode rebuilds large rule sets on change and degrades badly past a few thousand Services; nftables mode went stable in 1.33 and does incremental updates. It is still not the default in 1.37, but IPVS mode has been deprecated since 1.35 it goes off by default in 1.40, behind the KubeProxyIPVS feature gate, and is removed entirely in 1.43. New clusters should land on nftables. Cilium's kube-proxy replacement sidesteps the question entirely with eBPF.
NodePort and LoadBalancer cover traffic from outside. NodePort opens the same high port on every node; LoadBalancer is NodePort plus a cloud-controller-manager loop that provisions an actual load balancer pointing at those ports. Set externalTrafficPolicy: Local when you need real client IPs and are willing to accept uneven load distribution with Cluster, the second hop SNATs and your access logs become useless.
Ingress and Gateway API cover HTTP routing, and neither is implemented by the control plane. They are configuration objects that a controller NGINX, Envoy Gateway, Traefik, a cloud ALB controller watches in order to configure a proxy that itself runs as Pods and is exposed by a LoadBalancer Service. Gateway API is the direction of travel; Ingress is in maintenance.
Traffic distribution is the one Service field most teams should be setting and aren't. trafficDistribution: PreferSameZone (GA in 1.35; it replaced the ambiguously named PreferClose, which remains a deprecated alias) keeps traffic inside an availability zone when healthy endpoints exist there. On a three-zone cluster that removes roughly two-thirds of your cross-zone data transfer for a one-line change. PreferSameNode goes further for node-local daemons.
DNS is a Service too
CoreDNS runs as a Deployment behind a ClusterIP. Every Pod's /etc/resolv.conf points at it with ndots:5 and a list of search domains, which means any name with fewer than five dots gets tried against every search domain first. A lookup of api.example.com can cost four failed queries before the right one. Set dnsConfig.options with ndots: 2 on chatty workloads, or use fully qualified names with a trailing dot, and run NodeLocal DNSCache on anything large. DNS resolution failures are the most common "the network is broken" report that turns out to be neither the network nor broken.
What breaks when each component is down
Component | Responsibility | What happens when it fails |
|---|---|---|
kube-apiserver | Validates, admits and persists all state; serves every watch | No reads, no writes, no new deployments. Running workloads keep serving; nothing converges |
etcd | Durable, quorum-replicated store of desired state | Loss of quorum makes the cluster read-only. High fsync latency looks like a slow, flaky cluster |
kube-scheduler | Assigns Pods to nodes by writing | New Pods stay |
kube-controller-manager | Runs Deployment, ReplicaSet, node lifecycle, EndpointSlice and other loops | Rollouts freeze mid-way, dead nodes are never marked NotReady, Services stop tracking Pod churn |
cloud-controller-manager | Provisions LBs, attaches volumes, labels nodes | New LoadBalancer Services never get an address; volume attach/detach hangs |
kubelet | Runs and reports on Pods bound to its node | Node goes NotReady after ~50s; containers keep running until eviction ~5 min later |
Container runtime (CRI) | Creates sandboxes and containers via containerd or CRI-O | Pods stick in |
CNI plugin | Allocates Pod IPs and programs Pod networking |
|
kube-proxy | Programs the dataplane from EndpointSlices | Existing connections survive; new connections to ClusterIPs fail or hit dead backends |
CoreDNS | Cluster service discovery | Intermittent timeouts and 5-second stalls that read as application latency |
Triage rules that follow from the model
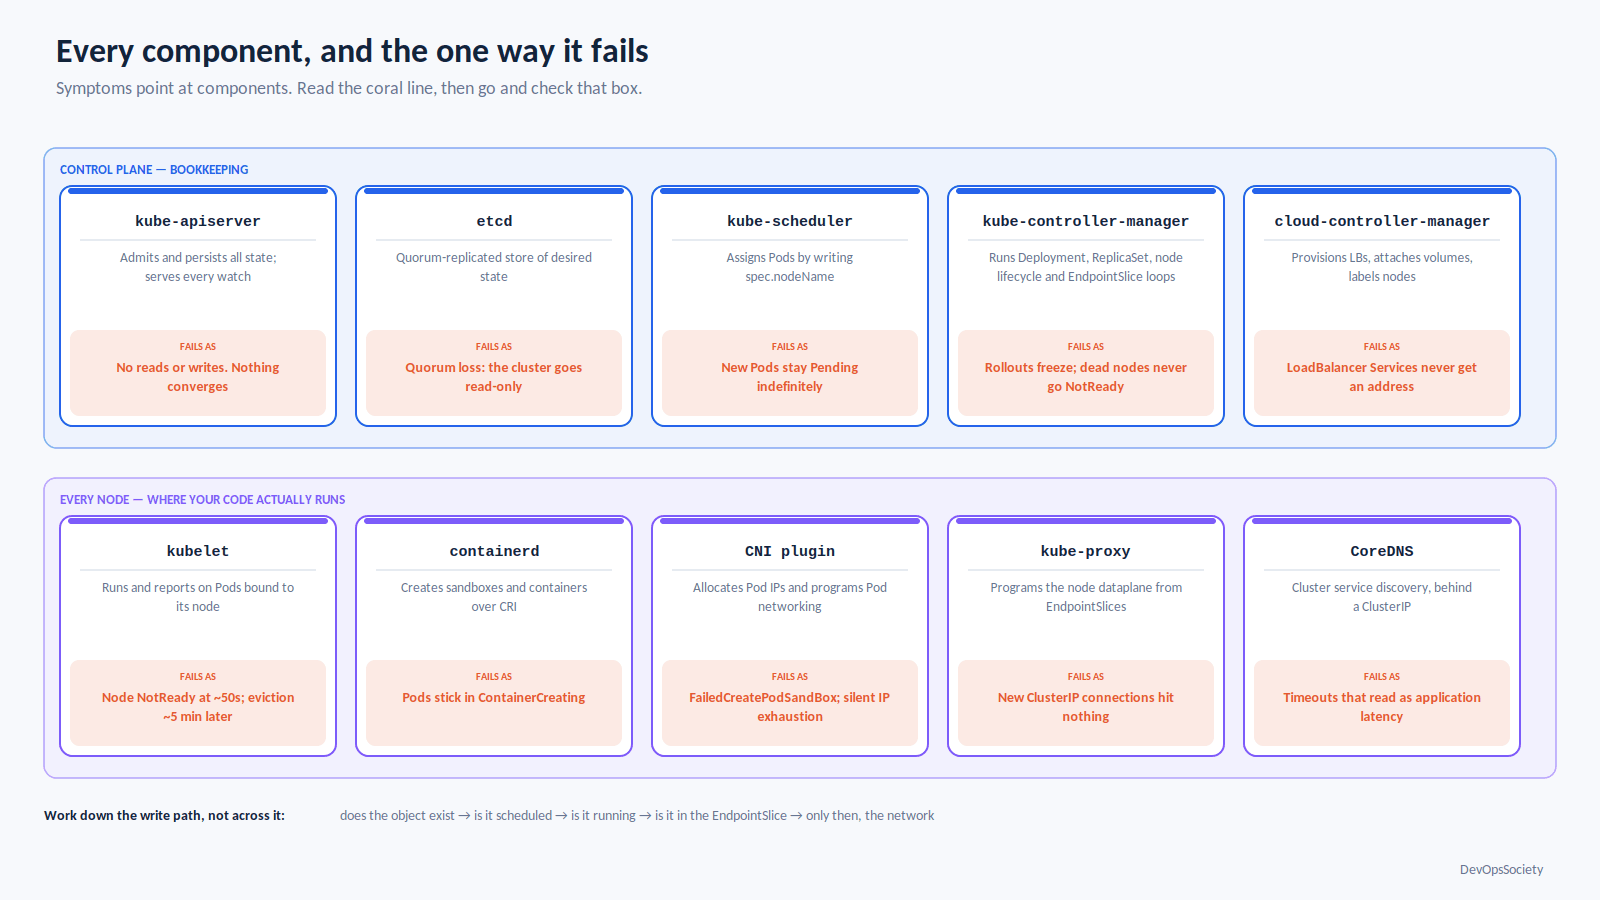
When something is wrong, the structure above gives you an ordering. Work down the write path, not across it.
Does the object exist?
kubectl get -o yamlit. If your change isn't there, the problem is upstream of the cluster auth, a rejected admission webhook, or a pipeline that never applied.Is it scheduled? Empty
spec.nodeNamemeans scheduler or capacity.kubectl describewill name the predicate that failed, and it is almost always resource requests or a taint.Is it running? Scheduled but not running is a node-level problem: image pull, CRI, CNI, or volume attach. The events on the Pod name which one; the kubelet journal confirms it.
Is it in the EndpointSlice? Running but not receiving traffic is nearly always a readiness probe or a selector typo, not networking. Check the slices before you touch anything network-shaped.
Only then suspect the network. And when you do, test with a Pod IP first, then the ClusterIP, then the DNS name. Whichever hop fails tells you whether you're looking at CNI, kube-proxy, or CoreDNS.
The one habit worth building is checking apiserver and etcd health first when several unrelated things break at once. Independent-looking failures across different namespaces are usually one shared dependency, and it's almost never a coincidence. For deeper dives on individual pieces scheduling, networking, and operating clusters at scale see the rest of our Kubernetes coverage.