Somebody on your team asked for eight H100s. Six months later the cluster exists, the bill is the largest line item in the engineering budget, and the average GPU utilisation across the fleet is somewhere around twenty per cent. Nobody can tell you which jobs are wasting the capacity, because the only metric anyone collects is "allocated", and allocated has been pinned at 100% since week two.
That gap between allocated and useful is the central problem in GPU infrastructure, and almost every decision below feeds into it. This article covers how to pick the right accelerator, when the interconnect topology genuinely constrains you, how to share a device without lying to yourself about isolation, how scheduling works on Kubernetes now that Dynamic Resource Allocation has landed, and how to buy capacity in a market where availability — not price — is usually the binding constraint.
Choosing a GPU: capacity, then bandwidth, then compute
There is a strict priority order here, and getting it wrong is expensive in a way that is hard to unwind.
Memory capacity is the first gate because it is binary. A model either fits in HBM or it does not. Exceed a CPU request and the kernel throttles you; exceed GPU memory and CUDA raises an out-of-memory error and the process dies. No swap, no graceful degradation. Size for peak resident memory — weights, activations, KV cache, allocator fragmentation headroom — not for the average.
Memory bandwidth is second because it sets the speed limit. Autoregressive decoding at small batch sizes is memory-bound: generating each token requires streaming the entire weight set out of HBM. An H100 SXM has 80 GB of HBM3 at roughly 3.35 TB/s. The H200 keeps the same compute and moves to 141 GB of HBM3e at 4.8 TB/s, which is why it is often the better inference part despite identical tensor cores. Shipping B200 carries 180 GB of HBM3e at up to 8 TB/s (the 192 GB number that circulated at announcement is not what landed in volume — check the datasheet for the SKU you are actually quoted).
Peak FLOPS is the least useful number on the spec sheet. Headline figures assume sparsity is active and the lowest supported precision is in use, describing a ceiling real kernels rarely approach. Two parts with similar advertised FLOPS can behave very differently on your workload depending on the memory system, kernel maturity and how well the model's shapes map to the tensor cores. Treat FLOPS as a tiebreaker between parts that already passed the capacity and bandwidth gates.
What you're deciding | The spec that decides it | Failure mode if you get it wrong |
|---|---|---|
Does the workload run at all | HBM capacity | Hard OOM; process dies at load or at long context |
Tokens per second at low batch | Memory bandwidth | Latency SLO missed; more replicas than budgeted |
Throughput at large batch / training step time | Compute (tensor core throughput) | Slower training; usually a cost problem, not an outage |
Can you shard a model across devices | NVLink presence and topology | Sharded inference runs but is dominated by collectives |
How many tenants per device | MIG support | Noisy neighbours, or unusable partitions |
Whether the job survives the night | Spot vs reserved capacity | Preemption mid-epoch with no checkpoint |
When a smaller GPU with more memory wins
Here is the position, stated plainly: if a model fits on one GPU with headroom, buy the cheapest, slowest GPU it fits on. Do not buy a faster card and shard.
Every sharding strategy taxes every forward pass. Tensor parallelism across two devices means an all-reduce per layer: tolerable on NVLink, capable of eating most of your speedup over PCIe. A 48 GB L40S at 864 GB/s running a quantised 30-billion-parameter model on one device will often beat two faster cards running it split in half, because the single-device path has no collectives at all.
The corollary matters just as much: when you are memory-constrained, adding memory is a step change and adding compute is a rounding error. Moving a long-context serving workload from 80 GB to 141 GB cards can grow the KV cache enough to lift concurrency substantially without touching the model. A card with more FLOPS and the same memory changes almost nothing. This is the same reasoning that drives capacity planning across the wider AI infrastructure stack, sharper here because there is no elasticity to hide behind.
The exception is training. Training throughput at large batch sizes really is compute-bound, and there the fast part earns its premium. Do not carry an inference heuristic into a training cluster.
Interconnect: when topology actually matters
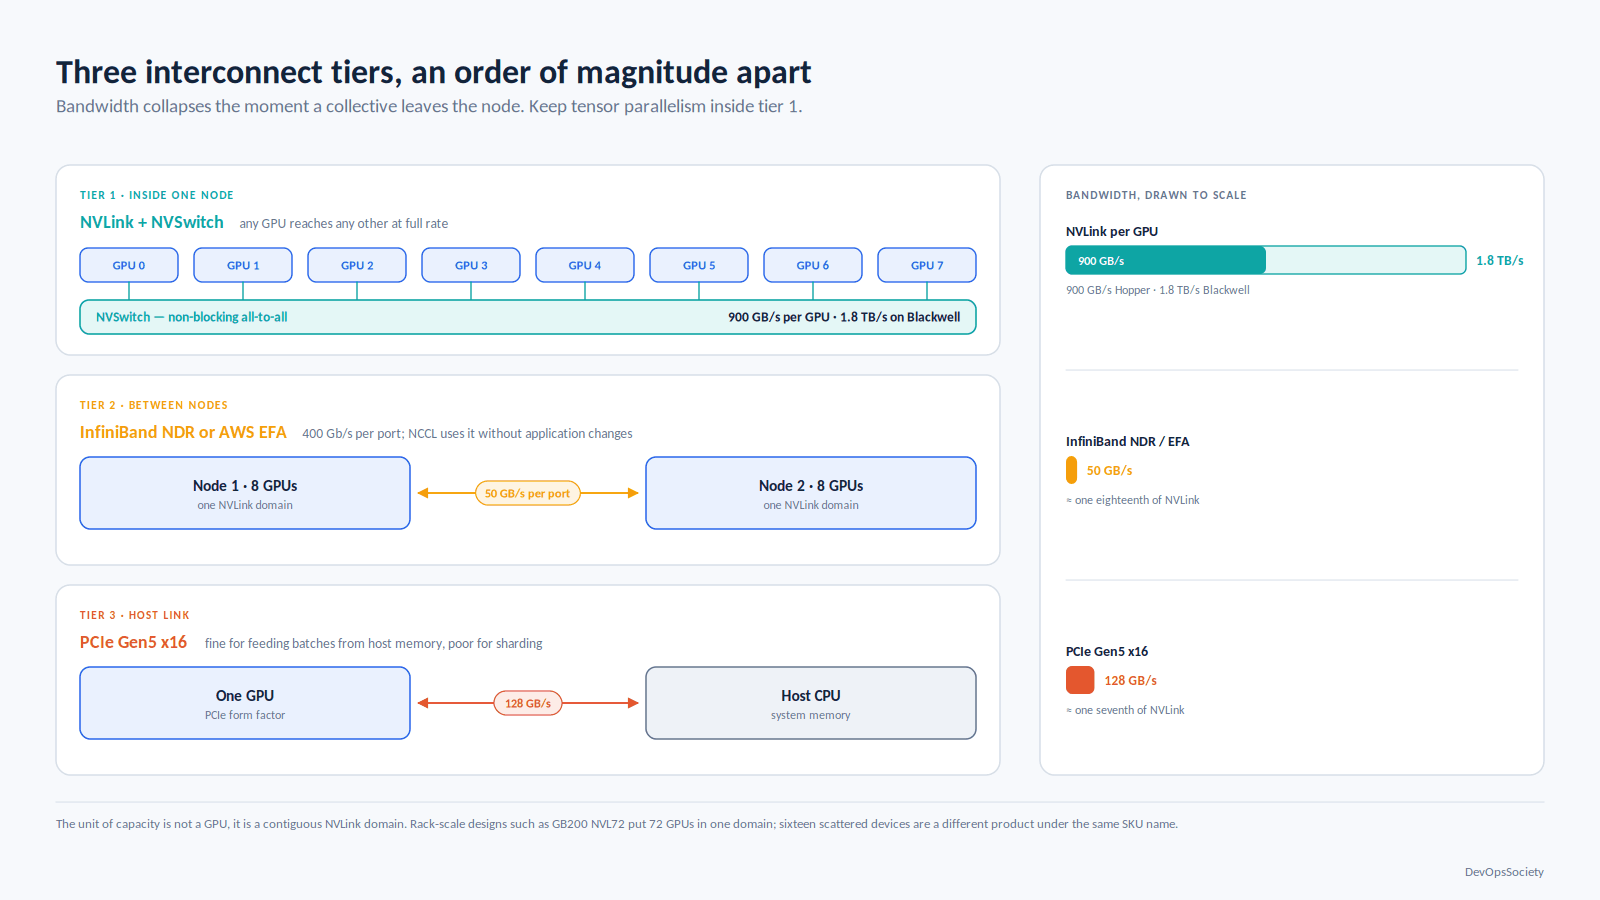
Three tiers, an order of magnitude apart each time.
Inside a node, NVLink connects GPUs directly. Hopper-class parts get about 900 GB/s of aggregate bidirectional bandwidth per GPU; Blackwell roughly doubles that to 1.8 TB/s. NVSwitch turns those point-to-point links into a non-blocking all-to-all fabric so any GPU can reach any other at full rate, which is what makes an eight-GPU node behave like one large device. Rack-scale designs such as GB200 NVL72 extend a single NVLink domain across 72 GPUs, which changes what "fits on one machine" means.
Between nodes you are on the network: InfiniBand NDR at 400 Gb/s per port is 50 GB/s, and AWS offers EFA as its equivalent, with NCCL integration so collective libraries use it without application changes. Either way, inter-node bandwidth sits roughly an order of magnitude below intra-node NVLink, and latency is worse by more than that.
PCIe is the fallback. Gen5 x16 gives about 128 GB/s bidirectional — plenty for a single GPU pulling batches from host memory, and the reason PCIe-form-factor cards are a poor choice for sharded workloads.
Topology matters when, and only when, a single logical operation spans devices. Tensor parallelism shards individual layers and is extremely sensitive: keep it inside one NVLink domain. Pipeline parallelism passes activations at stage boundaries and tolerates the network. Data parallelism only synchronises gradients once per step and tolerates it well. Independent inference replicas do not care at all — eight separate model servers on eight PCIe cards is a perfectly good design.
The consequence for cluster design: your unit of capacity is not "a GPU", it is "a contiguous NVLink domain". When you ask a provider for sixteen GPUs, ask whether that is two full nodes or sixteen devices scattered across a region. Those are different products sold under the same SKU name.
Sharing a GPU: three mechanisms, three very different guarantees
Whole-device allocation is the default and it wastes a lot of silicon on small workloads. The three ways out are not interchangeable.
MIG (Multi-Instance GPU) partitions an A100, H100, H200 or newer datacentre part into as many as seven instances, each with its own slice of HBM, cache paths and memory bandwidth, enforced in hardware. Profiles are fixed sizes (1g.10gb, 3g.40gb, 7g.80gb and so on for an 80 GB card), and reconfiguring a node's layout means draining it. In exchange you get genuine isolation: one tenant cannot OOM another, and a fault is largely contained.
Time-slicing is the device plugin round-robining CUDA contexts onto the whole GPU. Nothing is partitioned: every replica sees the full framebuffer and can allocate all of it, so one greedy process starves the rest of the card. There is no fault isolation either.
MPS (Multi-Process Service) runs client processes through a single CUDA context so kernels from different processes execute concurrently rather than being context-switched. Throughput beats time-slicing for many small kernels, and you can cap per-client memory and SM share. But clients share a fault domain: a fatal error in one can take down the MPS server and its siblings.
Mechanism | Memory isolation | Fault isolation | Performance predictability | Use it for |
|---|---|---|---|---|
Whole GPU | Total | Total | High | Anything with an SLO; all training |
MIG | Hardware-enforced slices | Largely contained | High within a profile | Multi-tenant production inference, shared research clusters |
MPS | Soft caps only | Shared fate | Medium | Many small cooperative jobs from one trusted team |
Time-slicing | None | None | Low | Dev, notebooks, CI — never production |
The rule: time-slicing is for developer laptops that happen to be in a datacentre. If a workload has an SLO, give it a whole GPU or a MIG instance.
apiVersion: v1
kind: ConfigMap
metadata:
  name: time-slicing-config
  namespace: gpu-operator
data:
  dev-pool: |-
    version: v1
    flags:
      migStrategy: none
    sharing:
      timeSlicing:
        # Advertise as nvidia.com/gpu.shared so a pod must opt in explicitly
        renameByDefault: true
        # Reject pods asking for >1 shared replica: the request is meaningless
        failRequestsGreaterThanOne: true
        resources:
          - name: nvidia.com/gpu
            replicas: 4
Setting renameByDefault: true is the part people skip and regret: without it, a production deployment requesting nvidia.com/gpu can land on an oversubscribed node and start sharing HBM with three notebooks.
Scheduling GPU infrastructure on Kubernetes
Kubernetes treats CPU as compressible and fractional. GPUs, under the classic device plugin model, are extended resources: integers only, requests must equal limits, no overcommit, no bursting.
apiVersion: v1
kind: Pod
metadata:
  name: vllm-server
spec:
  # GPU nodes are tainted so ordinary workloads can't drift onto them
  tolerations:
    - key: nvidia.com/gpu
      operator: Exists
      effect: NoSchedule
  nodeSelector:
    nvidia.com/gpu.product: NVIDIA-H100-80GB-HBM3
  containers:
    - name: server
      image: vllm/vllm-openai:latest
      resources:
        limits:
          nvidia.com/gpu: 2   # whole devices; must equal requests
          memory: 64Gi        # host RAM only — nothing here bounds HBM
The memory limit governs host RAM. Nothing in that spec constrains GPU memory, which is why two containers on a time-sliced device can happily destroy each other.
Device plugin versus DRA
Dynamic Resource Allocation graduated to GA in Kubernetes v1.34, with the core resource.k8s.io/v1 types — DeviceClass, ResourceSlice, ResourceClaim and ResourceClaimTemplate — now stable. It exists because "give me two of nvidia.com/gpu" cannot express the things that actually matter: give me two GPUs on the same NVLink domain, with at least 80 GB each, sharing a device between these two containers in the same pod.
apiVersion: resource.k8s.io/v1
kind: ResourceClaimTemplate
metadata:
  name: big-memory-gpu
spec:
  spec:
    devices:
      requests:
        - name: gpu
          exactly:
            deviceClassName: gpu.nvidia.com
            # Attribute selectors are the point: ask for capability, not a SKU
            selectors:
              - cel:
                  expression: device.capacity["gpu.nvidia.com"].memory.compareTo(quantity("70Gi")) >= 0
Do not rip out the device plugin this quarter. DRA needs a vendor driver, the surrounding ecosystem of autoscalers, quota systems and cost tooling is still catching up, and several of the most interesting pieces (partitionable devices for dynamic MIG, device taints) landed after the core API on their own timelines. For most teams running managed Kubernetes on EKS or its equivalents, stay on the device plugin for steady-state serving and pilot DRA on one topology-sensitive training workload.
Gang scheduling and queueing
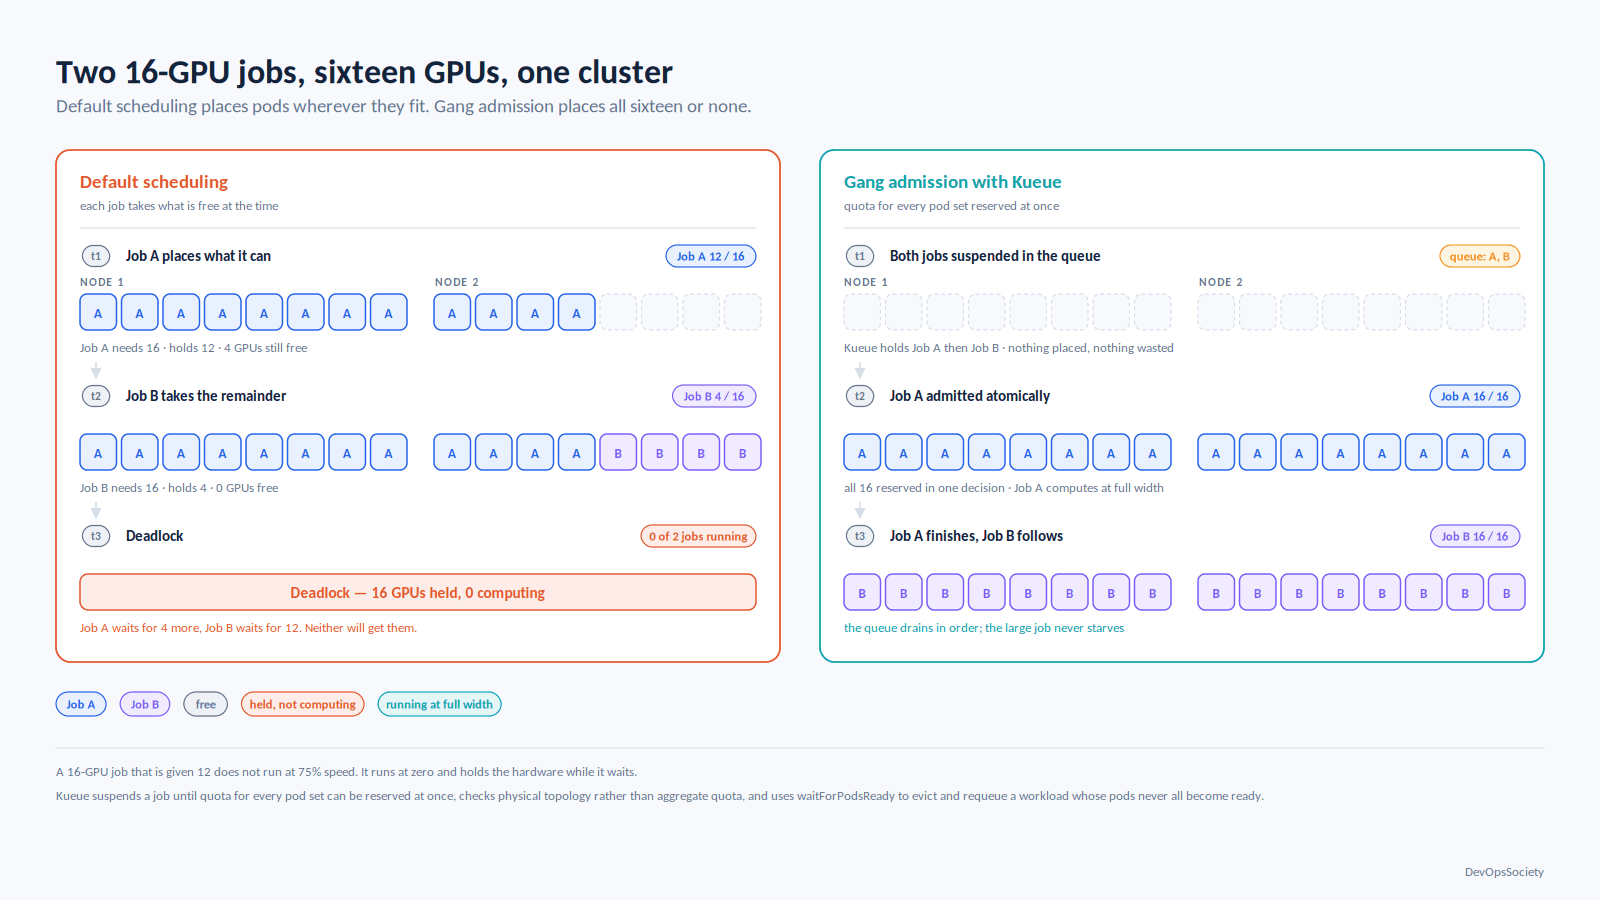
A distributed training job that needs sixteen GPUs and gets twelve does not run at 75% speed. It holds twelve GPUs hostage waiting for four more that a different half-scheduled job is holding. Default Kubernetes scheduling makes this deadlock trivially easy to produce.
Gang scheduling — all pods admitted together or none — is not optional on a shared cluster. Kueue is the Kubernetes-native answer: it suspends jobs until quota for every pod set can be reserved at once, supports topology-aware scheduling so it checks physical fit rather than just aggregate quota, and has waitForPodsReady as a timeout-based safety net that evicts and requeues a workload whose pods never all become ready. Volcano covers similar ground with a gang plugin and is the older choice in HPC-flavoured environments.
Queueing is the other half. Researchers will always submit more work than the cluster holds, and the correct behaviour is a queue with fair-share and borrowing between teams, not a pile of Pending pods and a Slack thread. Without it the largest jobs starve, because small ones keep slipping into the gaps.
Utilisation is the cost lever that dwarfs the others
Negotiating a better rate moves your GPU infrastructure spend by some percentage. Lifting fleet-wide utilisation from 25% to 60% more than halves the effective cost of every unit of work you produce. Nothing else on the cost menu is in that league.
Three things reliably destroy utilisation:
Idle allocation. A notebook pod holding an H100 overnight looks perfectly healthy to the scheduler. Reap on inactivity, not on crash.
Data starvation. If the training loop waits on the input pipeline, utilisation flatlines with no obvious culprit. Cache to local NVMe and confirm your storage tier can feed the GPUs before blaming the model.
Oversized allocation. A batch scoring job given a whole H100 to use 12 GB wastes most of a card. That is what MIG is for.
Put two numbers on the same dashboard: allocation (what the scheduler gave out) and activity (what the silicon actually did, via SM or tensor pipe activity). The spread between them is your real inefficiency, and it is usually shocking the first time anyone looks. The discipline in the AWS Well-Architected cost pillar applies here unchanged; only the magnitude differs.
Procuring capacity: four models, and an availability problem
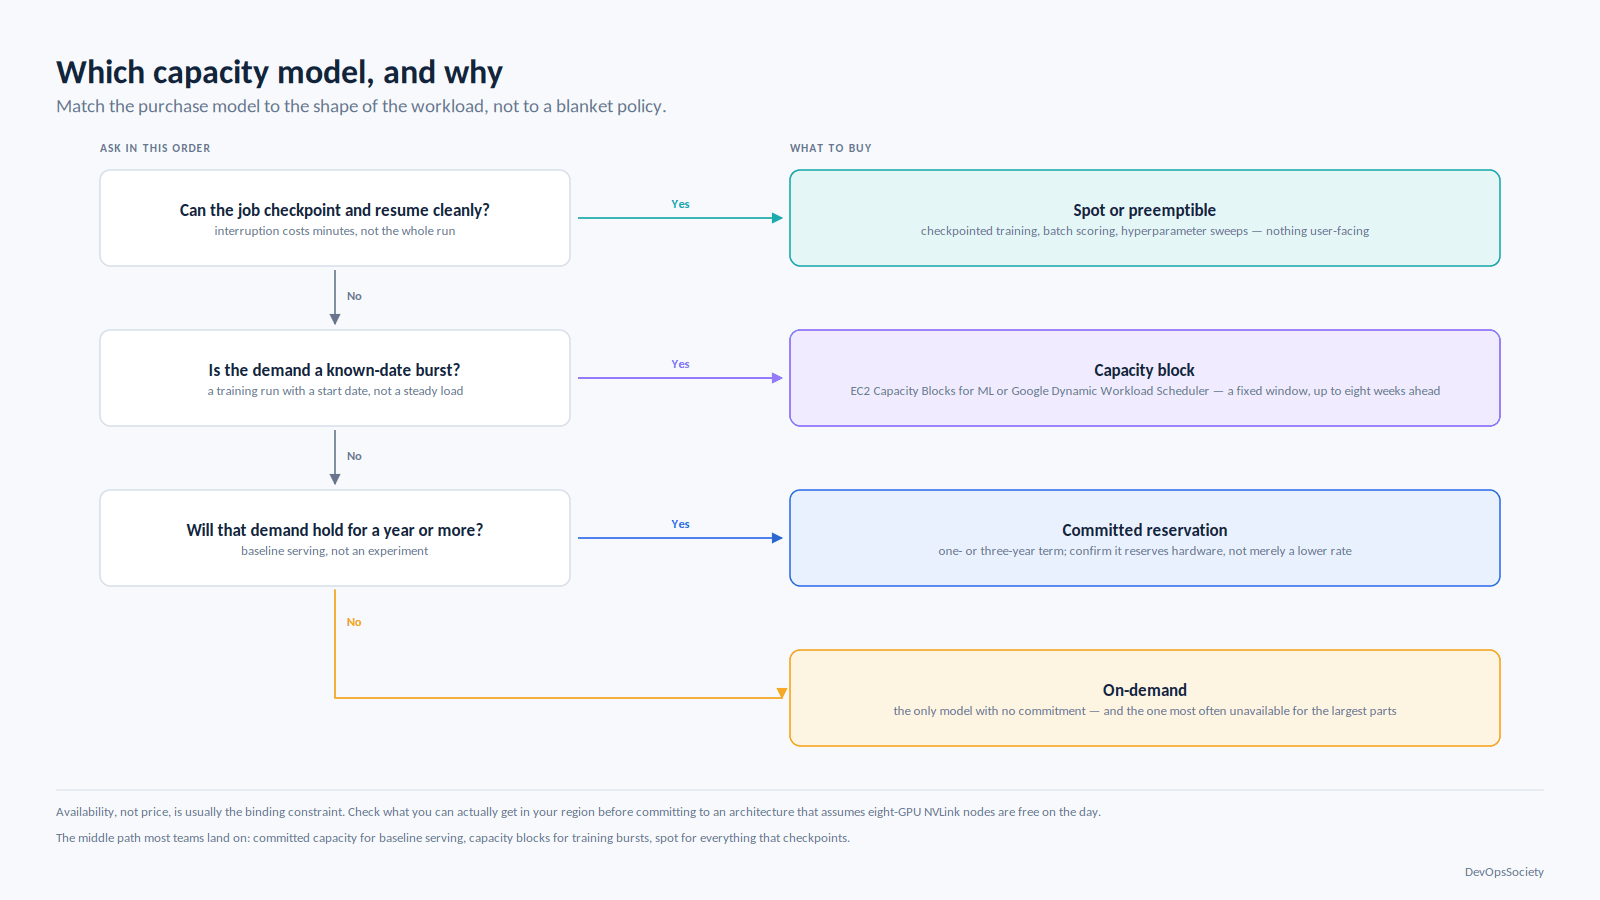
On-demand costs the most per hour and is the only model with no commitment. It is also, for the largest accelerators, frequently unavailable in the region you want. GPU capacity is not elastic the way general-purpose compute is, and that is the part most teams underestimate.
Committed capacity — reservations, savings plans, committed-use discounts — trades a one- or three-year term for a substantial discount and, more importantly, for capacity assurance. Read the fine print on whether the discount actually reserves hardware or merely bills you less for hardware you still have to win a race for.
Spot is deeply discounted and can vanish with a couple of minutes' notice. It suits checkpointed training, batch scoring and hyperparameter sweeps, and nothing user-facing. The prerequisite is real: if your job cannot checkpoint and resume cleanly, spot costs more in lost work than it saves.
Capacity blocks are the newest model and the most honest about the underlying scarcity. AWS EC2 Capacity Blocks for ML reserve a defined set of GPU instances for a fixed future window, up to eight weeks ahead, placed close together in an UltraCluster for low-latency collectives. Google's Dynamic Workload Scheduler offers a comparable calendar-mode reservation. These fit the real shape of training work — a known burst on a known date — far better than on-demand or a three-year commitment.
Buy or rent
The honest threshold: rent until you have eighteen months of demonstrated, near-continuous demand for at least a few dozen GPUs, and only then evaluate buying.
Renting wins for almost everyone because the failure mode of owning is brutal. Buying commits you to one generation at a moment when generational jumps are large, and to power, cooling, InfiniBand fabric, firmware management and a hardware RMA process. Depreciation on an accelerator two generations behind is not gentle.
Buying wins when utilisation is genuinely sustained above roughly 70%, the workload is stable enough that a three-year hardware horizon is credible, you already run datacentre space with power headroom (GPU nodes draw far more per rack unit than the general-purpose fleet, and retrofitting cooling is where these projects die), and residency constraints rule out the alternatives. Sustained utilisation is the load-bearing condition. At 30%, owning the hardware just means owning the waste.
The middle path most teams land on: committed cloud capacity for baseline serving, capacity blocks for training bursts, spot for everything interruptible. That is not a compromise, it is the right answer for most balance sheets.
Monitoring: the four signals that matter
Standard container metrics tell you nothing about a GPU. Install the NVIDIA GPU Operator, which brings DCGM and dcgm-exporter, and scrape into Prometheus.
# Live view: SM activity, tensor pipe activity, framebuffer, power, temperature
dcgmi dmon -e 1002,1004,252,155,150 -d 1000

# The field that tells you why a node just lost four jobs
dcgmi dmon -e 230 -c 1     # DCGM_FI_DEV_XID_ERRORS
Activity, not utilisation.DCGM_FI_DEV_GPU_UTIL reports whether any kernel was resident, which a single trivial kernel satisfies. DCGM_FI_PROF_SM_ACTIVE and DCGM_FI_PROF_PIPE_TENSOR_ACTIVE tell you whether the streaming multiprocessors and tensor cores were doing work. A node showing 95% "utilisation" and 8% SM activity is idle with extra steps.
XID errors.DCGM_FI_DEV_XID_ERRORS carries the last XID the driver raised, and the code tells you who to blame. Some XIDs indicate application bugs such as illegal memory access; others indicate hardware trouble — uncorrectable ECC events, or the GPU dropping off the PCIe bus, which needs a drain and a hardware ticket rather than a job retry. Alert on the hardware classes and route the application classes back to the submitting team. Without this, a single failing card silently eats jobs for weeks.
Thermal and power throttling. A card clock-limited by temperature or a power cap runs measurably slower while reporting no errors at all. This shows up as a training step time that crept upward after an airflow change, and it is invisible unless you graph throttle reasons alongside temperature.
ECC and row remapping. Correctable single-bit errors are normal at low rates; a rising rate, or any uncorrectable event, is a pre-failure signal. Modern datacentre parts remap failed memory rows, and a node accumulating remappings should be scheduled out before it takes a multi-day training run with it.
What to do first
If you are starting from the twenty-per-cent-utilisation position at the top of this article, work in this order:
Instrument before you optimise. Deploy DCGM and put allocation and SM activity on one graph. Everything else is guessing.
Alert on XIDs and thermal throttling. These are the failures that look like flaky software for months.
Give every workload a tenancy decision. Whole GPU for anything with an SLO, MIG where utilisation data justifies it, time-slicing only in dev.
Put a queue in front of the cluster. Kueue with gang admission, before you buy another node. Scheduling wins are cheaper than hardware.
Match the purchase model to the workload shape, not to a blanket policy: committed for baseline, capacity blocks for known training bursts, spot for anything that checkpoints.
One caveat worth carrying: GPU infrastructure is constrained less by any spec sheet than by what you can actually get in your region on the day you need it. Check availability before committing to an architecture that assumes eight-GPU NVLink nodes will be free when the training run is ready. More on the surrounding stack in our AI infrastructure coverage.